Physical Therapy
Learn more about motion monitor
Motion Monitor
Here is a sequence of three frames captured with the Motion Monitor as a person performed a golf swing. Sensors were placed on each part of the body represented by a straight segment on the stick figure. These data were captured at 140 frames per second. You can see that the first frame is at a point in the swing where the club has begun to swing down toward the ball. The second frame is after ball contact. The third frame is the finish of the follow through. The white lines are force vectors from the force platforms used under each foot. Figures can be rotated in any direction and viewed from any perspective. Below, a stick figure representation of a golf swing.
 Motion Monitor Main
Data collection
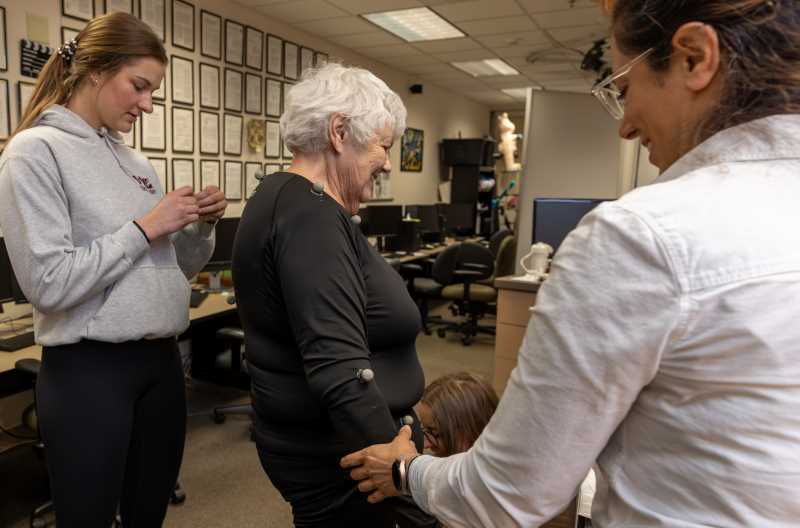
Straps are applied to hold the sensors: straps are wrapped around body segments which we wish to measure. In the image to the right, straps are placed on the forearm and upper arm segments. This placement would allow the elbow joint to be monitored during movement. Below, attaching cuffs.
 Motion Data Collection
Determining body segments
The distal ends of segments is determined by touching a designated sensor to a bony landmark on the distal end of each segment. In this picture, the distal forearm is being defined by touching the sensor to the distal radius (indicated by the arrow). For this example, it was also necessary to define segments by touching the sensor to the distal ulna, proximal ulna, and the lateral humerus (to represent the shoulder). Below, identifying joint centers.
 Motion Body Segments
Performance of the movement
The next step in the data collection process is to have the subject perform the desired movement. In this example the subject is performing a waving motion in the frontal plane. Sensors on the body are tracked in real time in three dimensions. Below, capturing movement.
 Motion Performance
Interactive display of movement
The motion is then displayed on the screen in the form of a stick figure (this can be changed to a humanoid or skeleton) which represents the actual movement performed by the subject. Calculations can then be made to assess the quality and quantity of movement pattern. To the right is a skeletal representation of a single point in the movement pattern. The figure can be displayed in any perspective (from above, below or side). Data from joint or segment angular position, sensor position, segment endpoint or segment center of mass can be generated alongside this figure. Velocity and accelerations of each can also be graphically displayed. Below, a computer display.
 Motion Interactive Display
Clinical and research uses of motion analysis
Motion analysis in physical therapy is used but not limited to the assessment of gait patterns, sitting, standing or working postures, or the quantitative outcomes of therapeutic procedures or interventions. This is commonly used in conjunction with EMG, Force and Pressure Distribution Measurements.


