Chapter 4: Why are Taxes So Taxing
A page within Menard Family Initiative
In Chapter 4, Claudia Williamson Kramer discusses how the economic cost of a tax includes more than just the revenue it directly collects. She also uses empirical estimates of the various indirect costs of taxation to estimate the total cost of each dollar raised by taxes. As shown in Figure 4.1, Kramer breaks down direct and indirect costs into various components.
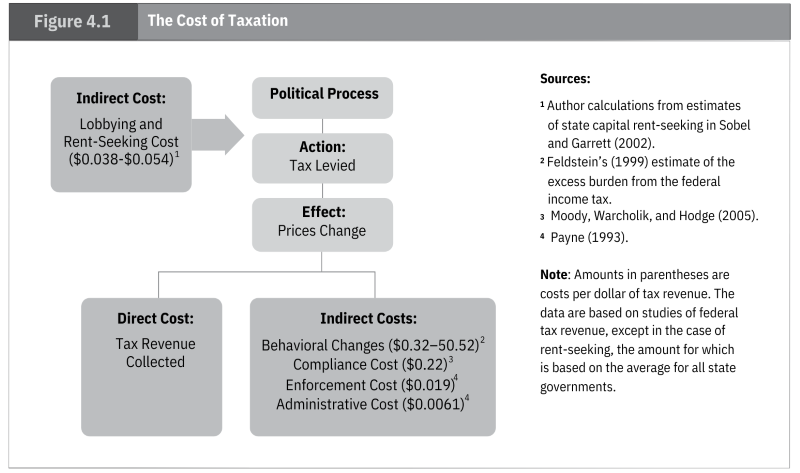 Figure 4.1
The first indirect cost she discusses are those that arise from lobbying and rent-seeking through the political process, what Sobel and Bolen referred to as unproductive entrepreneurship in the previous chapter. When a state government utilizes its capacity to collect revenue, businesses and special interest groups will have an incentive to spend resources to alter tax policy to their benefit. One estimate of these costs is between 3.8 and 5.4 percent of tax revenue. Applying this estimate to the taxes raised over the 2018 to 2019 period suggests that “Wisconsin incurred indirect costs of $1.16 to $1.65 billion in wasted resources devoted to altering policy.”
Another indirect cost of taxes is the “deadweight loss” that occurs when producers and consumers respond to the imposition of a tax on some activity by forgoing that activity and substituting for others that are now relatively less expensive. In other words, when “transactions do not take place because of higher prices due to taxation, there is an economic loss to society.” When the availability of alternatives is greater, consumers and producers are better able to respond to the changes in relative prices that result from taxation. In such cases, the deadweight loss generated is greater. Deadweight losses are estimated to be between 32 and 52 percent of tax revenue.
Even if taxes did not alter consumer and producer behavior or incentivize unproductive entrepreneurship, they will still create indirect costs because there are costs associated with administering and enforcing them which – according to one estimate – come out to about 3 percent of tax revenue. Finally, there are also compliance costs imposed on consumers and businesses, which include “time spent bookkeeping, filling out tax forms, hiring accountants to deal with changes in tax laws, and more” and are estimated to be about 22 percent of tax revenue.
According to the author, “these indirect costs add up to $0.60 to $0.82 for every $1.00 of tax revenue collected. In other words, one tax dollar costs the Wisconsin economy between $1.60 and $1.82.” Since Wisconsin collected $30.6 billion in taxes over the 2018 to 2019 period, it also generated between $18.4 billion and $25.1 billion in indirect costs.
Next, Kramer compares Wisconsin’s average individual tax burden to those of other states. As indicated by Table 4.3, when accounting for both state and local taxes, Wisconsinites’ tax burden as a share of income is lower than that of its neighboring states, excluding Michigan.
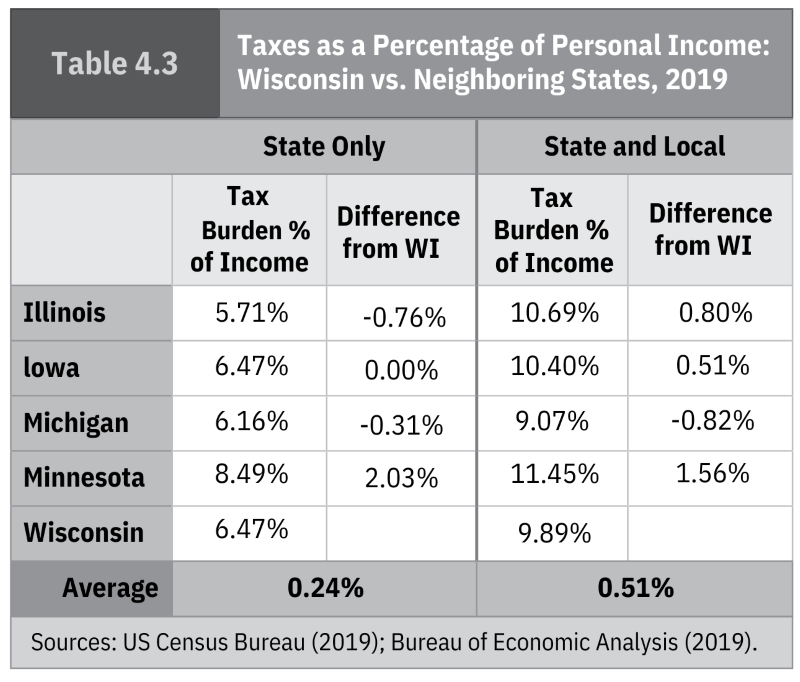 Table 4.3
This comparison is especially important as producers and consumers are more likely to take their economic activity across these nearby borders if doing so will reduce their tax burden. Finally, Kramer discusses the expansive academic literature which consistently finds that taxes inhibit economic growth.